
Statistics
Statistics in the sidebar shows pull request activity from the history Pullwatch keeps.
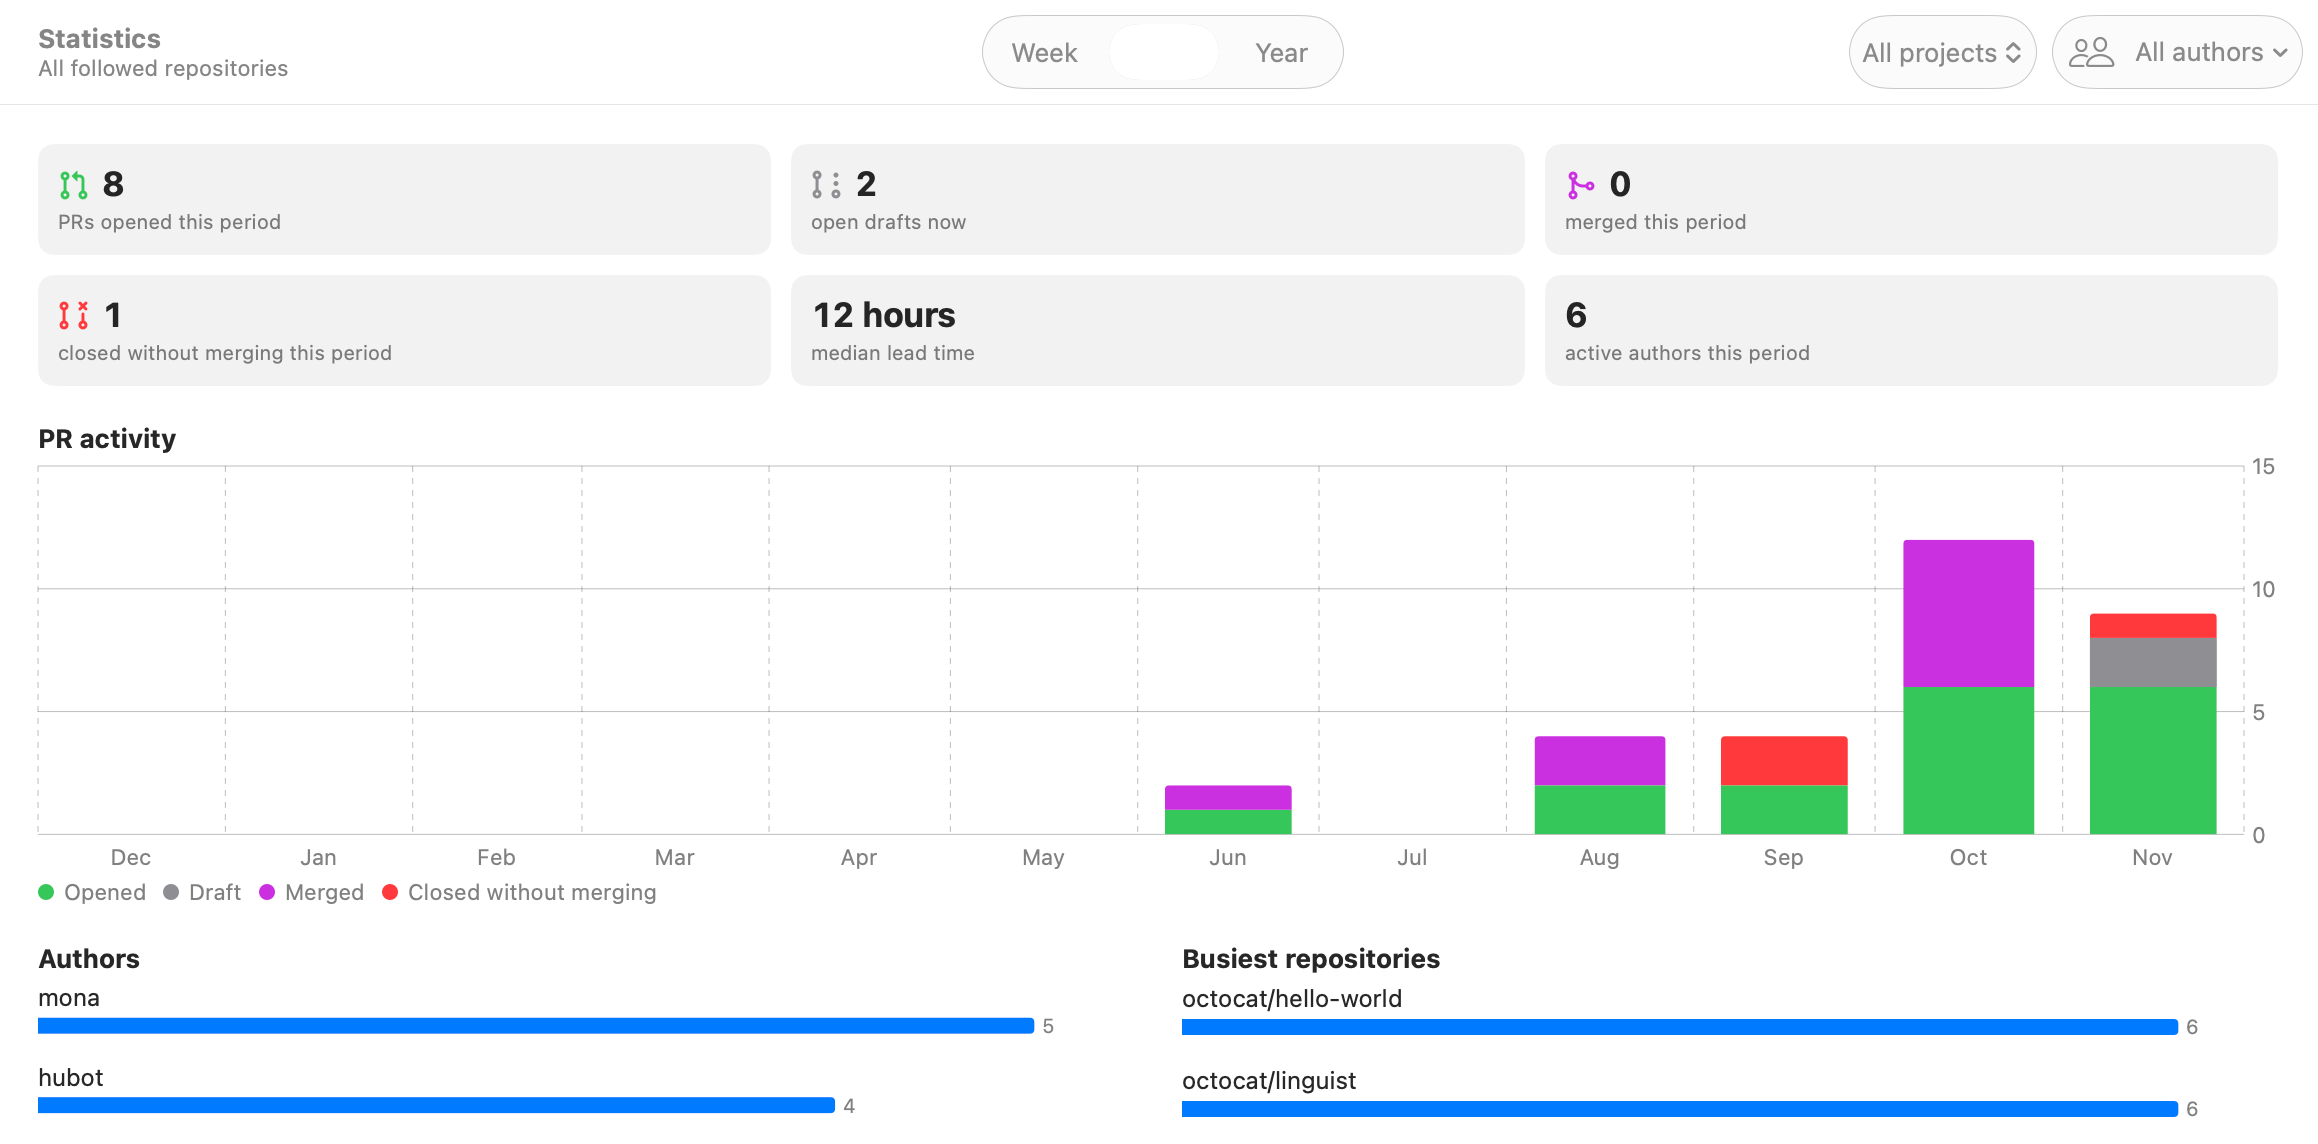
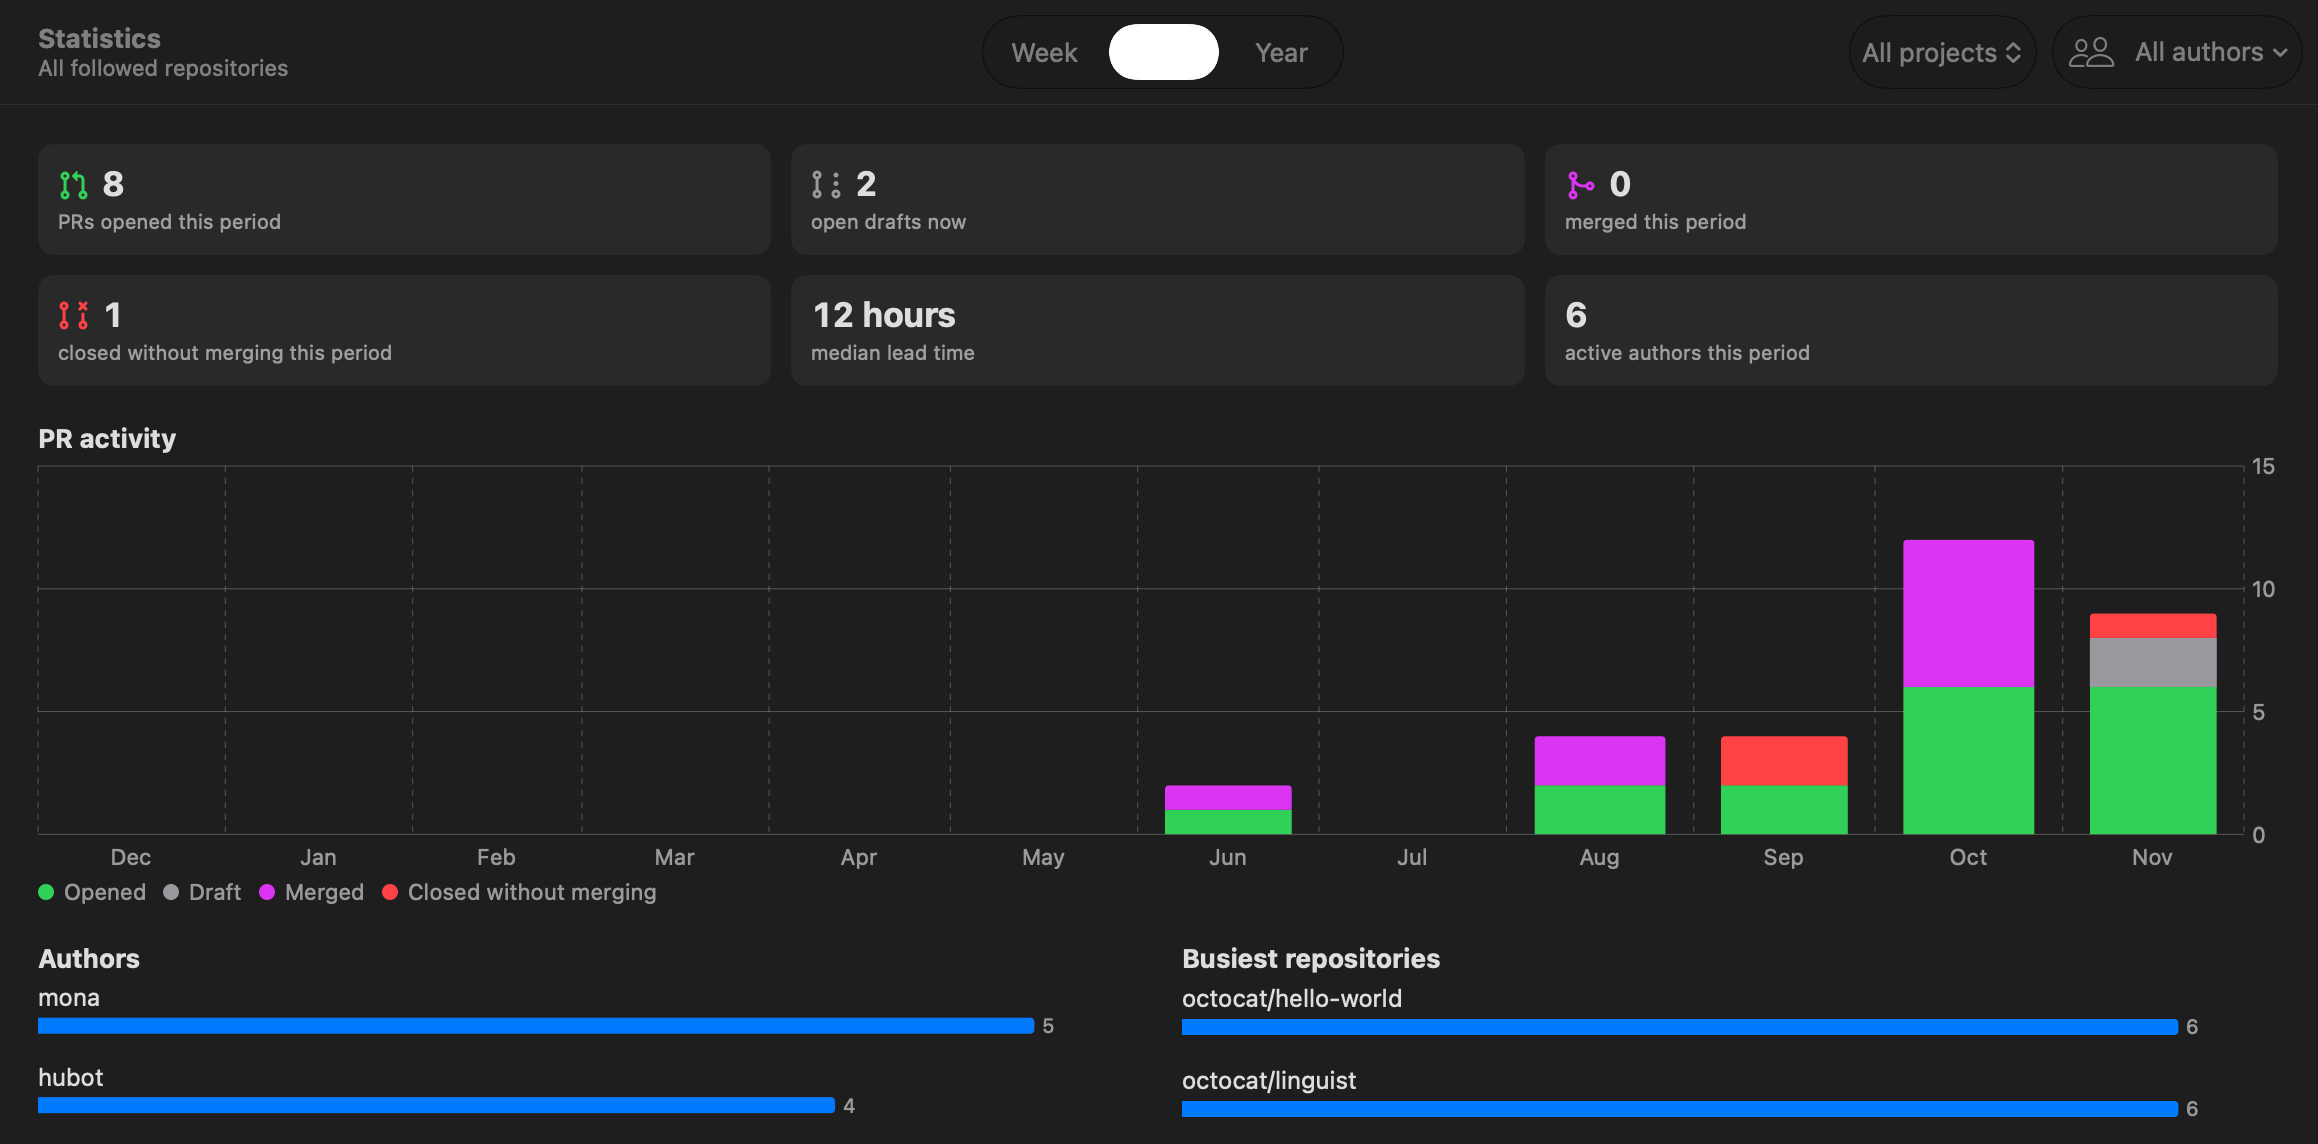
- Opened and merged pull requests per week, month or year (the last 12 weeks, 12 months or 5 years).
- The pull requests opened and merged in the current period, open drafts, the median time from opening to merge, and the number of active authors.
- Rankings of authors and of the busiest repositories.
Filter on a project or an author; click a name in the ranking to select it, and from there jump to that author’s pull requests or the repository’s page. Bots ([bot] in the name) are hidden by default. Count co-authors in the author menu counts a pull request for each of its co-authors too.
A repository page has the same chart per month for that repository alone.
Statistics count pull requests, not commits, and go back as far as the history does (Settings, General, Keep history).